
Kal Kotecha PhD
Vertical integration is one of the most crucial strategies companies in the junior mining space can implement. With large CAPEX and OPEX inherent in the mining industry, achieving vertical integration can be imperative to develop highly specified minerals and adapt to the unique conditions that individual mines exhibit while reducing risk and maintaining stable production costs. Some of the most common advantages gained through vertical integration include increased control over value-added functions, the ability to invest and develop greatly specialized assets, and increase production flexibility (Strategy Train, 2009). In the fluctuating market that defines the junior mining sector, these advantages – particularly those related – to control are critical to a company’s long term success.
One company that has embodied the vertical integration strategy is MX Gold Corp. (TSX-V: MXL) (“MX” or “the Company”). MX Gold Corp. is a junior mining company focused on the mining, exploration and development of advanced projects located in the Kootenay region of British Columbia. The Company’s primary focus is its high-grade Willa gold and copper project located 12 kilometres south of Silverton, B.C. Having recently rebranded from Discovery Ventures Inc. to the current name of MX Gold Corp., the Company has experienced exciting new progressions which have correlated with a stock price increase. Junior Gold Report has extensively written about MX Gold Corp. under its previous name, and the reintroduction of MX Gold Corp. as a rising stock warrants further discussions about the competitive advantages the Company’s business model fosters along with the new developments that we believe will serve to benefit its current and future shareholders.
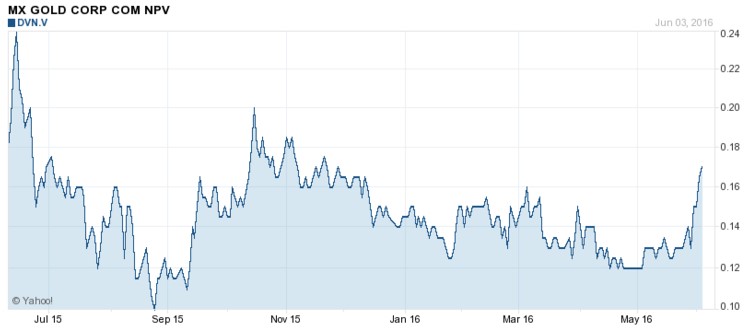
MX Gold Corp. is currently valued at around $0.20, have experienced rapid growth in the past month, moving from a price of $0.125 on May 16th to its current price. This share price increase coincided with a corporate announcement detailing the increase of the Company’s size of its private placement financing. On June 6th, the Company announced that it had increased the number of Units it would issue at a price of $0.12 per Unit to 33,333,333 units from the previously announced 25,000,000 units. Gross proceeds of $4,000,000 are projected to be earned from the release. Funds raised will be used toward advancing its flagship WillaMAX Project and for general working capital.
As discussed in previous articles, the four most important drivers of value for this company are:
- High AU-CU grades based on measured, indicated and inferred resources
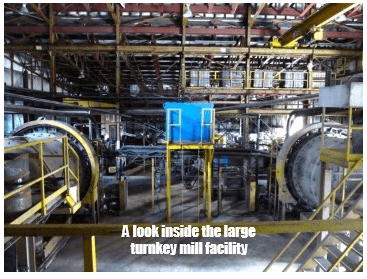
- 100%-owned nearby mill – modern turnkey facility acquired for a minimal capital expenditure
- Strong business leadership and financial strength
- Near-term cash flow potential from a permitted 10,000 tonne bulk sample
Flagship Project – WillaMAX Project
The Company’s primary focus is its high grade Willa Gold, Copper and Silver project located 12 kilometres south of Silverton, B.C. In 2015, MX Gold completed the accretive acquisition (100% ownership) of the Willa project and the Max Molybedum Mine and Mill Complex, a fully permitted 1000 tonne per day mill and tailings facility. The two separate components of the project – the mine and the mill complex – combine to produce a strong vertical integration that has resulted in positive movement in the stock’s price each time an advancement has been made in the past two years.
Willa Mine
The Willa Gold, Copper and Silver mine contains high-grade resources as outlined below and has been explored since the 1890’s when the area was dubbed the “Silvery Slocan.” The property houses major gold and copper resources along with identified silver resources and has been extensively explored and researched, which has contributed to well measured resource estimates. Between 1980 and 2005 the property was owned by various companies including BP Minerals, Rio Algom and others who collectively invested approximately $18M to explore and develop the property. As you can imagine, this means solid access to the location and many of the property’s “kinks” already worked out.
The most recent data on the resources within the property came in 2012 through the NI 43-101 report which provided the following outcomes:
| Category | Tonnes | Au (g/mt) | Cu (%) | Ag (g/mt) |
| Measured | 198,000 | 5.36 | 0.83 | 8.30 |
| Indicated | 627,000 | 4.97 | 0.86 | 9.50 |
| Measured + Indicated | 825,000 | 5.07 | 0.85 | 9.20 |
| Inferred | 151,000 | 4.21 | 0.71 | 9.80 |
Source: MX Gold Corp. – Corporate Slide Deck
The resource is amenable to open pit mining with increasing grades at depth that have been measured at greater than 15g / t Au. These features collectively define a property with excellent exploration and development potential.

In March, the Company announced plans to activate the Willa Gold, Copper, Silver deposit for 2016. MX received a permit to mine a 10,000 tonne bulk sample and is in the process of working with the requisite ministries to apply for a small mines permit. Recently, the Company announced that following the completion of the construction of a road and an engineering study, truck runway lanes and upgrading erosion and sediment control structures will be completed.
In this same announcement, the Company highlighted further plans for property development and provided a timeline of 4-5 months to commence full underground operations on the property. The Company states that phase 2 of its plan, expansion and development, is now 90% complete. Phase 3 will occur between August and December of 2016 and includes the installation of other surface facilities along with preparation and commissioning of equipment and facilities.
Considering the stock’s price was driven up 100% from the mere announcement of increased units available for purchase, shareholders should be salivating for an announcement that development and production of the resource site will begin. We can reasonably assume that this point will occur sometime in late 2016 or early 2017, at which time we project a major stock price increase for MX Gold Corp.
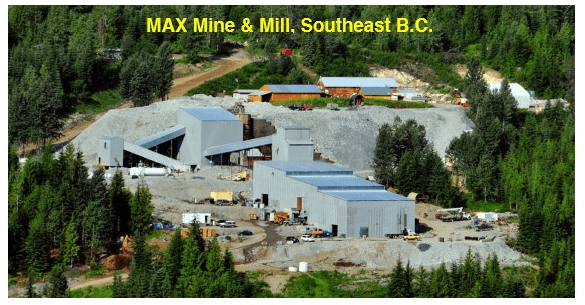
MAX Molybdenum Mine and Mill Complex
The most significant development MX Gold Corp. has made in recent years is the purchase of the MAX Molybdenum Mine and Mill Complex, located approximately 135km away from the Willa mine. This facility is nearly brand new and is regarded as a first rate production centre and was purchased for just $6 Million. This is wildly impressive considering the fact that, up to 2012, in an effort to build a molybdenum operation that unfortunately failed because of the collapse in moly prices, Roca Mines & Forty Two Metals invested over $100 million building the MAX mine and mill. Further, the Company’s investment came with a $50 million tax pool, which will serve as a major benefit to MX in the coming years of its operation. The mine and facility are so pristine that they won the 2009 B.C. Mining & Sustainability Award. Engineers for the Company have stated that the process of treating the mineralized gold-copper-silver material from the Willa mine, as opposed to the originally intended molybdenum, is a relatively simple technical transition for this mill and will require minimal capital expenditure. The CAPEX for the project is very low, at a rate of just $12.8 Million.
The acquisition of the mine, and more importantly the mill complex, is a brilliant move by the Company, and references back to my statement at the beginning of this article; MX Gold Corp. is embodying the critical vertical integration strategy that increases the likelihood of making junior mining companies successful. Once the Willa mine is prepared for development, the Company will have complete and controlled access to a state of the art production facility with low CAPEX and OPEX because of the nature of its acquisition. Moving forward on the value chain, the Company will be able to integrate its core business areas and flexibly determine a production schedule for its mined resources, acting on bullish mineral markets while easing during times of stagnant growth.
Described by Resource Wire contributor Jay Currie as as “creative thinking” the vertical integration strategy is something that more junior mining companies should explore. As noted by Currie, “moving a resource towards profitable production involves more than simply drilling out the site and reporting the results. The reality is that the resources have to be mined and processed” (Currie, 2014). MX Gold Corp.’s vertical integration strategy encompasses these two crucial consideration, but the scope of the strategy does not simply end there.
The Company’s Chairman and CEO, Dan Omeniuk, is the president of Trappers Transport, a North American leader in providing temperature controlled transportation services. Dan’s company recently agreed to a $7 Million credit facility to advance to the WillaMax Project. With Mr. Omeniuk’s involvement, MX now has access to at-cost transportation expertise to move its raw materials from the Willa Mine to the MAX Mill Complex for processing and onward to finishing stages or end users. Holding the supply, processing and distribution components of the Company’s key business functions, MX Gold Corp. is positioned to leverage its assets strategically to execute the production and distribution of its resources with great precision.
Conclusion
The economics of the WillaMAX Project are encouraging, and showcase an outstanding IRR and NPV projection, as detailed below:
PEA Base Case Highlights – 500 tpd Operation – 4.25-year Mine Life
Total revenue: $164 million
CAPEX: $12.8 million
OPEX: $82.8 million
NPV (10% discount): $55 million
IRR (pre-tax): $412%
Metal price assumptions ($USD): $1,200 Au / $3.00 Cu / $3.00 Cu
Though the stock’s price has risen greatly in recent weeks, the projections above still suggest that the MX Gold Corp.’s stock (TSX-V: MXL) remains undervalued, especially for investors with the capacity to purchase the stock and carry it for an annual term. When viewing MX’s stock performance over the past year, the overall trend is beginning to turn for the Company and over the next few months, the stock’s price can be expected to return to the region it was at in September 2015 with upcoming development and phase progression announcements. Looking further, when mine and mill production begin in late 2016 or early 2017, expect the stock’s price to leap even higher, returning to levels seen one year ago and possibly higher.
Source: MX Gold Corp. website
Share Structure
Shares Outstanding: 95,124,718
Options: 21,366,200
Warrants: 10,378,600
Fully Diluted Shares: 126,869,518
Source: MX Gold Corp. website
MX Gold Corp.’s vertical integration strategy will see the Company through the coming months and move it to a point of highly controlled and flexible extraction, production and distribution of its resources. The integration of these crucial components will result in success for the Company and ultimately, success for its investors.
Works Cited
Currie, Jay. “Creative Thinking at Discovery Ventures.” Creative Thinking at Discovery Ventures. Resource Wire, 27 Feb. 2015. Web. 11 June 2016
MX Gold Corp. N.p., n.d. Web. 11 June 2 2016 <http://mxgoldcorp.com/>
“Why Choose Vertical Integration? Benefits and Drawbacks.” Strategy Train. Lifelong Learning Programme, 2009. Web. 11 June 2016
Happy Investing!
Disclaimer
© 2010 Junior Gold Report
Junior Gold Report’ Newsletter: Junior Gold Report’s Newsletter is published as a copyright publication of Junior Gold Report (JGR). No Guarantee as to Content: Although JGR attempts to research thoroughly and present information based on sources we believe to be reliable, there are no guarantees as to the accuracy or completeness of the information contained herein. Any statements expressed are subject to change without notice. JGR, its associates, authors, and affiliates are not responsible for errors or omissions. Consideration for Services: JGR, it’s editor, affiliates, associates, partners, family members, or contractors may have an interest or position in featured, written-up companies, as well as sponsored companies which compensate JGR. JGR has been paid by the company written up. Thus, multiple conflicts of interests exist. Therefore, information provided herewithin should not be construed as a financial analysis but rather as an advertisement. The author’s views and opinions regarding the companies featured in reports are his own views and are based on information that he has researched independently and has received, which the author assumes to be reliable. No Offer to Sell Securities: JGR is not a registered investment advisor. JGR is intended for informational, educational and research purposes only. It is not to be considered as investment advice. Subscribers are encouraged to conduct their own research and due diligence, and consult with their own independent financial and tax advisors with respect to any investment opportunity. No statement or expression of any opinions contained in this report constitutes an offer to buy or sell the shares of the companies mentioned herein. Links: JGR may contain links to related websites for stock quotes, charts, etc. JGR is not responsible for the content of or the privacy practices of these sites. Release of Liability: By reading JGR, you agree to hold Junior Gold Report its associates, sponsors, affiliates, and partners harmless and to completely release them from any and all liabilities due to any and all losses, damages, or injuries (financial or otherwise) that may be incurred.
Forward Looking Statements
Except for statements of historical fact, certain information contained herein constitutes forward-looking statements. Forward looking statements are usually identified by our use of certain terminology, including “will”, “believes”, “may”, “expects”, “should”, “seeks”, “anticipates”, “has potential to”, or “intends’ or by discussions of strategy, forward looking numbers or intentions. Such forward-looking statements involve known and unknown risks, uncertainties and other factors which may cause our actual results or achievements to be materially different from any future results or achievements expressed or implied by such forward-looking statements. Forward-looking statements are statements that are not historical facts, and include but are not limited to, estimates and their underlying assumptions; statements regarding plans, objectives and expectations with respect to the effectiveness of the Company’s business model; future operations, products and services; the impact of regulatory initiatives on the Company’s operations; the size of and opportunities related to the market for the Company’s products; general industry and macroeconomic growth rates; expectations related to possible joint and/or strategic ventures and statements regarding future performance. Junior Gold Report does not take responsibility for accuracy of forward looking statements and advises the reader to perform own due diligence on forward looking numbers or statements.


![elliet wave]](http://www.juniorgoldreport.com/wp-content/uploads/2016/06/elliet-wave.png)