
Kal Kotecha PhD
Individual investors receive one enduring piece of investment advice offered across nearly all forums and by all authors, to achieve success in the market: diversify your portfolio. A diversified portfolio reduces risk by enabling adjustment of investments based on market conditions, has been shown to produce higher returns in the long term, and allows individuals to pursue multiple financial goals simultaneously. This common sense approach to personal finance has been thoroughly tested and has historically been the best way to help ensure financial success with the ebb and flows of the market.
With this in mind, the question of why more companies in the junior mining sector don’t pursue a diversified portfolio with their holdings arises. Would it not be practical for companies, depending on their circumstance, to hold multiple investments and interests in various properties, commodities and even operationally advantage facilities or technologies?
Today we profile one such company that is achieving this type of diversified portfolio, and as a result is positioning itself for both near and long-term stock success.
Equitorial Exploration Corp. (TSX-V: EXX) (“Equitorial” or the “Company), currently trading at $.05/share, is a Vancouver Based company engaged in acquisition, exploration and development of mineral properties located in Canada, Columbia and Panama. The Company holds a variety of assets, including its El Havila gold property located in Columbia, and maintains partnerships or direct stakes in several companies. The latter of these two segments of its profit structure is what we are focused on. The diversity of Equitorial’s partnerships and external corporate interests positions the organization to achieve rounded success in a fluctuating market.
The Company has interests primarily in companies, stimulating excellent synergies that will be advanced to the benefit of Equitorial’s shareholders. These three companies include:
- Cardiff Energy Corp.
- MineWorx Technology
- Mag One Products Inc.
Each of these companies operates in a different niche of the junior mining sector, offering Equitorial significant advantages in the market, as they can focus their financial and personnel resources on the area that is most lucrative at a given time based on market conditions.
Equitorial Exploration came out with some exciting news today!
Equitorial Exploration Corp. Completes $1,000,000 Investment in Mag One Products Inc. and Expands into Lithium Extraction Technology
_________________________________________________________
Vancouver, BC, Canada – May 24, 2016 – Equitorial Exploration Corp. (TSX Venture Exchange: EXX, Frankfurt: EE1) (the “Company”) wishes to announce that it has now earned the exclusive right to joint venture with Mag One on a 50/50 basis to fund the construction of Mag One’s first modular production facility for the extraction of Lithium and related products. This is in addition to the Company earning an exclusive right to enter into the first JV to fund, the construction of production facilities that will be used to produce magnesium metal and products.
As reported by Mag One on May 17, 2016, Mag One Operations has access to 30 million tonnes of magnesium tailings at a price of $1.00 (U.S.) per tonne. This crushed rock, which is sitting on the surface near Danville, Que., Canada, contains approximately 23 per cent magnesium and is sufficient for 70 years of production of magnesium at the target capacity of 100,000 tonnes annually.”
The Company has completed its financing of Mag One for $1,000,000 by purchasing 1,111,111 units of Mag One. The units consist of one common share at $0.90 accompanied by one share purchase warrant at $1.10 for one year.
Jack Bal, President of Equitorial Exploration Corp, states “We are very excited to expand into the Lithium extraction business with Mag One and their proprietary Lithium extraction technology.”
More will be discussed on Mag One in this article but the significant of the news cannot be underplayed. Equitorial has JV’d with a juggernaut both in the magnesium and lithium industry who’s technology is poised to change the landscape of the lithium industry.
Cardiff Energy Corp.
Cardiff Energy Corp. (TSX-V: CRS) is an emerging junior oil and gas company engaged in the acquisition, exploration, development and production of oil and gas properties in the U.S. In September 2015, Equitorial announced the signing of a Participation and Joint Venture Agreement with Cardiff to fund the completion of Cardiff’s Clayton #1H horizontal oil and gas well and to help expedite the development of its Runnels County oil and gas leases in Texas. The Company purchased a 15% working interest from Cardiff for USD$270,000 and was granted the opportunity to fund and purchase a 25% working interest on all future wells drilled on Cardiff’s leases in Runnels County. In October, this relationship was enhanced when the Company purchased an additional 15% working interest in Clayton #1H from Cardiff for USD$360,000 brining the Company’s total working interest in the well to 30%. Further, the Company was granted the option to fund future lease acquisitions was raised to a 40% stake on all lands acquired in the Runnels County region of Texas.
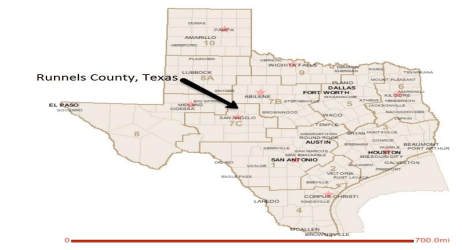
Source: Cardiff Energy Corp. – Location of Clayton #1H well
In December, Equitorial announced that Cardiff had completed an initial flow test on the Clatyon #1H well, reporting an initial flow rate of 275 Barrels of Oil Per Day without any stimulation via acid treatment to the formation. Representatives from Cardiff indicated that they were very pleased with the initial flow results and that they exceeded their initial expectations of what would be produced from the property.
The implications of these results are significant for Equitorial because the Clayton #1H oil and gas well is slated to enter production within the coming weeks (Capital Manager, 2016). With West Texas Intermediate oil reaching into the $40 sales range, 275 Barrels of Oil Per Day may generate $11,000 in sales. With Equitorial’s 30% interest in the Clayton #1H well, this would translate into $2,000 of cash flow into the company on a daily basis, totaling $60,000/month or $720,000 annually before production costs (approx. $15/barrel). This is a conservative estimate when factoring in the potential increase in Barrels of Oil Per Day with active stimulation of the well (Capital Manager, 2016).
Equitorial’s 30% stake within the Clayton #1H oil and gas well represents an opportunity for the Company to generate consistent revenue through the production and sale of a currently vital resource to our economy. Further, the Company’s option to finance 40% of future lease acquisitions by Cardiff demonstrates strong long-term planning by Equitorial as they are setting themselves up for long-term asset gains.
Equitorial’s relationship with Cardiff offers stakeholders short and long-term advantages, as the Company’s stock will likely increase when oil is produced and sold and will also increase in coordination with Cardiff’s stock as it seeks out additional properties within the Runnels County region of Texas.
Iberian Minerals – MineWorx Technologies Inc.
In October 2015, Equitorial entered into a debt settlement and share distribution agreement with MineWorx Technologies Inc., an extraction company which the Company owns 45% of. The agreement stipulated that the Company was to receive 5,181,547 shares in the capital of MineWorx at a price of $0.1566 per share to settle outstanding debt MineWorx owed to the Company totaling $808,547. This agreement resulted in Equitorial having ownership if a total of 17,025,000 MineWorx shares.
MineWorx is a private Canadian corporation which owns proprietary, patent pending, environmentally friendly, heavy metal extraction equipment and technologies. The technology is based on a mobile classification and gravimetric processing unit with an integrated water filtration, clarification and recycling system which allows for the concentration and extraction of heavy metals from soil, gravel or crushed material with minimal environmental impact, discharge and water consumption.
MineWorx also holds a patent pending process for the utilization of portable gravimetric extraction technologies at mine locations around the world to provide operators with a portable, low-cost, mineral extraction alternative, which in some locations, would reduce the usual permitting timelines due to the system’s minimal environmental footprint, impact and discharge.
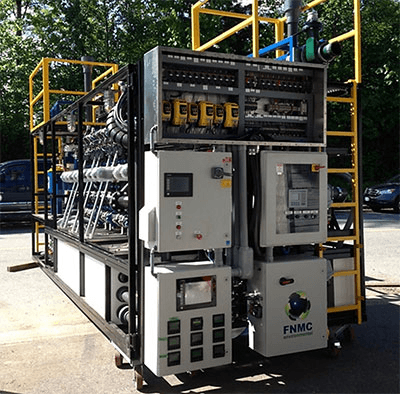
Source: Iberian Minerals – MineWorx’s extraction technology
The long and short of it is that MineWorx is a highly innovative heavy metal extraction company that has developed patents on environmentally friendly and economically efficient processes that have the potential to greatly reduce costs and improve productivity in mining operations. Equitorial’s interest in MineWorx is highly beneficial for the Company’s stakeholders because of the synergy between the two organizations and because of the fact that as MineWorx continues to develop and grow within the industry, Equitorial’s share price will increase in compliment to the growth.
In November 2015, MineWorx entered into an amalgamation agreement with Iberian Minerals Limited (TSX-V: IML). Under the terms of the amalgamation agreement, MineWorx shareholders received approximately 2.53646 common shares of Iberian for every one MineWorx common share. Along with its ownership of MineWorx, Iberian Minerals boasts a business strategy that is designed to engage its Spanish contacts and technical team towards the accumulation of high interest assets throughout Spain.
This, of course, represents a positive change to Equitorial’s relationship with MineWorx for two key reasons. The first, and most apparent, is the increase in total shares that the Company gained in Iberian. Specifically, Equitorial’s 17,025,000 shares in MineWorx transitioned to 43,183,231 shares in Iberian (17,025,000 shares x 2.53646 = 43,183,231 shares). As such, when Iberian’s share price increases as a result of advancing the innovative and incredible technology patented by MineWorx, Equitorial’s stake in Iberian will improve. Secondly, Iberian Minerals possesses the assets required to support MineWorx’s development in the market, ensuring that the technology is sold and utilized effectively.
The synergy between Equitorial’s business strategy and the technology being advanced by MineWorx via Iberian represents a net benefit to Equitorial’s shareholders, offering clear medium-term benefits for Equitorial’s share price as Iberian continues to grow.
Mag One Products Inc.
The last of Equitorial’s partnerships that we will discuss today is perhaps the most exciting. Mag One Products Inc.’s (CSE: MDD) objective is to become a processing and refining company, using its proprietary manufacturing technology that will allow it to be the world’s lowest-cost producer of 99.9% pure magnesium (Mg) metal ingots and ultra-pure magnesium compounds.
Recently (March 2016) Equitorial announced that Mag One has granted the Company a first right to a 50/50 joint venture to fund equally the construction of the first magnesium and refining production for use by Mag one to produce magnesium metal and related products. Upon the successful completion of the first production and refining facility under the joint venture terms, Equitorial shall then have the first right to enter into a further 50/50 joint venture in regard to participate to funding of the construction of the second production and refining facility on the same terms as the first joint venture.
Mag One differentiates itself in the junior mining sector through its proprietary manufacturing technology. Specifically, Mag One states that it holds a target operating cost that is at least 25% lower than existing global Mg producers, and a Mg sale price ranging from $2,400 to $4,3000 USD/tonne. Mag One’s annual profitability for each 5,000 tonne/year facility it develops is projected to be in excess of $5,000,000. A 100,000 tonne/year facility is therefore expected to generate profits in excess of $100M each year.
With Equitorial’s 50% stake in a forthcoming production facility, the potential direct revenue generation for the Company is significant. Especially when considering the expected growth in the global market for magnesium.
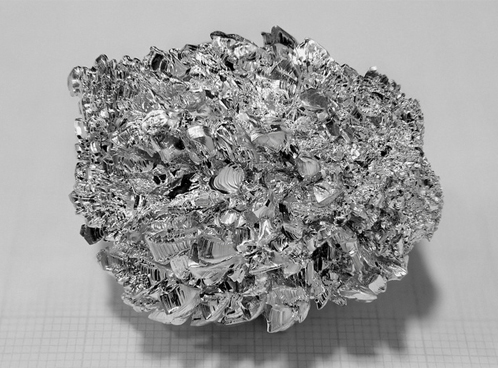
Source: Mag One Inc. – Magnesium
The current market environment that surrounds magnesium production production and distribution is advantageous for Equitorial’s partnership for three key reasons:
- Demand for magnesium compounds has grown steadily at a compound annual growth rate (CAGR) of slightly under 6% with demand growing slightly faster than the production pace (Berry, 2015)
- Currently, China is the largest producer of magnesium globally being responsible for between 70%-80% of production (Berry, 2015) and the United States imports the majority of its magnesium from the country. Equitorial and Mag One can achieve success within the market and gain a niche by leveraging their location advantage, securing corporate and industrial consumers in North America that prefer to source magnesia from regions closer to their production facilities.
- It is reasonable to forecast that demand for magnesium will improve in the long-term, as the mineral can be used to produce lightweight steel, which is becoming preferable in various consumer products including automobiles in order to achieve better performance, fuel economy and to meet requirements posed by environmental legislation related to material usage. As noted by Berry, there is an ample opportunity for additional magnesium usage in automobiles as a substitute for heavier metals (Berry, 2015) with current estimates cited from a report by the United States Automotive Materials Partnership stating that “by 2020, 250 pounds of magnesium will replace 500 pounds of steel and 90 pounds of magnesium will replace 130 pounds of aluminum per vehicle, resulting in an overall 15% weight reduction” (Berry, 2015) compared to the 10-12 total pounds of magnesium used in a vehicle now.
The relationship between Mag One and Equitorial showcases the Company’s propensity for strategic portfolio planning and an ability to drive synergies between parallel operations. The clear upward trend in demand for magnesium produced in North America highlights the potential long-term gains that this relationship will deliver to Equitorial’s stock price.
Conclusion
Equitorial Exploration Corp. (TSX-V: EXX) has effectively diversified its portfolio of partnerships and relationships with external companies to the benefit of its shareholders. The Company has positioned itself to improve its stock price continuously as a result of the short, medium and long-term growth that it will achieve as its partners advance their position in the market. At a current share price of $0.05 (May 20, 2016) investors looking for an organization that has strategic interests across the junior mining sector, effectively managing its risk in the fluctuating market, should look to Equitorial as a high potential growth organization.
Happy Investing!
Works Cited
Berry, C. (2015). A Closer Look at Magnesium. The Disruptive Discoveries Journal, 1-15.
“Positioned For Game-Changing Success.” Captial-Manager. 11 Apr. 2016. Web. 15 Apr. 2016.
Iberian Minerals. Web. 16 Apr. 2016.
Mag One Products Inc. Web. 15 Apr. 2016.
Cardiff Energy Corp. Web. 15 Apr. 2016.
Disclaimer
© 2010 Junior Gold Report
Junior Gold Report’ Newsletter: Junior Gold Report’s Newsletter is published as a copyright publication of Junior Gold Report (JGR). No Guarantee as to Content: Although JGR attempts to research thoroughly and present information based on sources we believe to be reliable, there are no guarantees as to the accuracy or completeness of the information contained herein. Any statements expressed are subject to change without notice. JGR, its associates, authors, and affiliates are not responsible for errors or omissions. Consideration for Services: JGR, it’s editor, affiliates, associates, partners, family members, or contractors may have an interest or position in featured, written-up companies, as well as sponsored companies which compensate JGR. JGR has been paid by the company written up. Thus, multiple conflicts of interests exist. Therefore, information provided herewithin should not be construed as a financial analysis but rather as an advertisement. The author’s views and opinions regarding the companies featured in reports are his own views and are based on information that he has researched independently and has received, which the author assumes to be reliable. No Offer to Sell Securities: JGR is not a registered investment advisor. JGR is intended for informational, educational and research purposes only. It is not to be considered as investment advice. Subscribers are encouraged to conduct their own research and due diligence, and consult with their own independent financial and tax advisors with respect to any investment opportunity. No statement or expression of any opinions contained in this report constitutes an offer to buy or sell the shares of the companies mentioned herein. Links: JGR may contain links to related websites for stock quotes, charts, etc. JGR is not responsible for the content of or the privacy practices of these sites. Release of Liability: By reading JGR, you agree to hold Junior Gold Report its associates, sponsors, affiliates, and partners harmless and to completely release them from any and all liabilities due to any and all losses, damages, or injuries (financial or otherwise) that may be incurred.
Forward Looking Statements
Except for statements of historical fact, certain information contained herein constitutes forward-looking statements. Forward looking statements are usually identified by our use of certain terminology, including “will”, “believes”, “may”, “expects”, “should”, “seeks”, “anticipates”, “has potential to”, or “intends’ or by discussions of strategy, forward looking numbers or intentions. Such forward-looking statements involve known and unknown risks, uncertainties and other factors which may cause our actual results or achievements to be materially different from any future results or achievements expressed or implied by such forward-looking statements. Forward-looking statements are statements that are not historical facts, and include but are not limited to, estimates and their underlying assumptions; statements regarding plans, objectives and expectations with respect to the effectiveness of the Company’s business model; future operations, products and services; the impact of regulatory initiatives on the Company’s operations; the size of and opportunities related to the market for the Company’s products; general industry and macroeconomic growth rates; expectations related to possible joint and/or strategic ventures and statements regarding future performance. Junior Gold Report does not take responsibility for accuracy of forward looking statements and advises the reader to perform own due diligence on forward looking numbers or statements